

This reference is aimed for developers and administrators.
Elvyx is a framework designed to monitor jdbc activity and collect that infomation into a built-in database. This information helps developers and administrators to improve java applications by giving an idea about database cache issues, times, etc... This reference gives you a quick idea about how elvyx works and what explains the parameters used.
Figure 1 shows the main elvyx components: driver, server and clients.
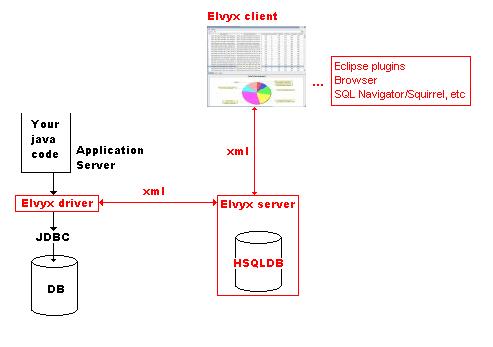
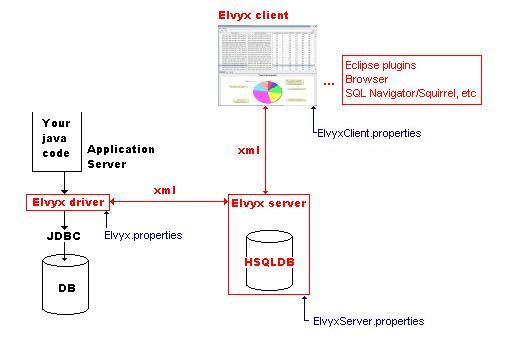
The driver is a wrapper that includes the real jdbc driver. It intercepts any call to connections, statements, datasources, etc... and collects the information and stores it into a file called statements.dat . If the elvyx server is running, the driver sends the information to the server; otherwise, it saves that information into statement.dat .
The driver uses elvyx.properties to get the real jdbc driver and url.
The file elvyx.properties has the following parameters.
driver = jdbc driver ( ex: oracle jdbc )
url = your database url
address = server location ( ex: localhost, ip )
port = server port ( ex: 4448 )
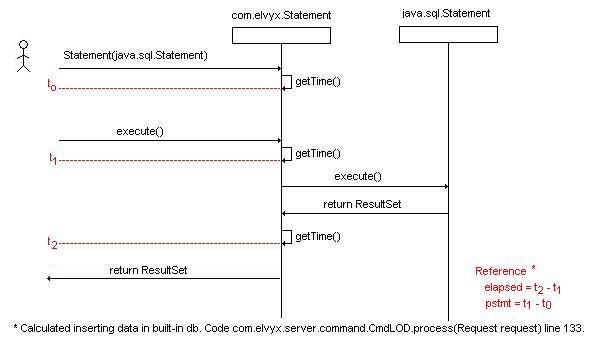
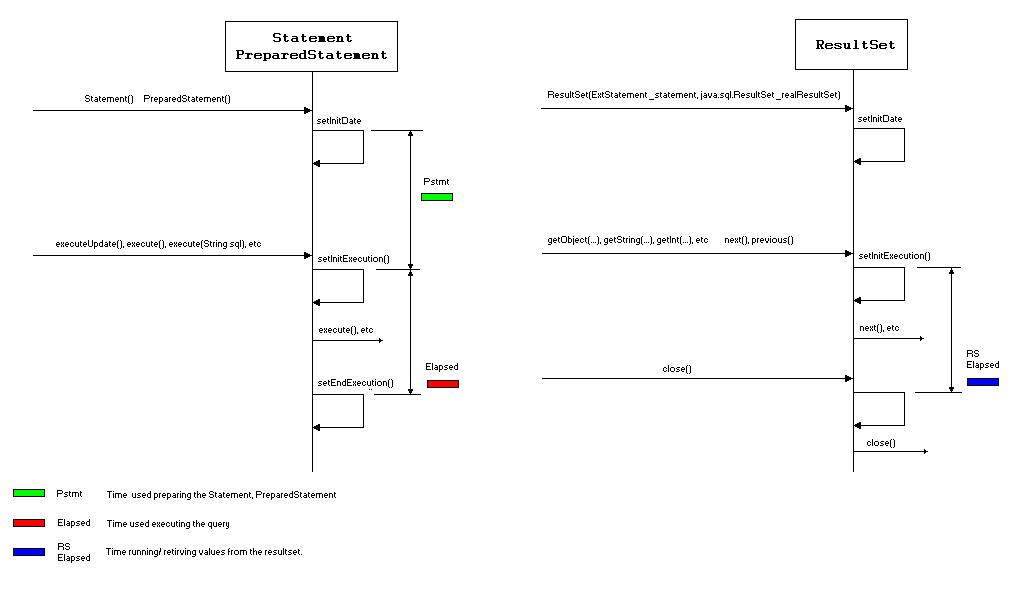
The following image shows how times are measured.
The Elvyx server is the framework kernel. It receives the driver data, loads the hsqldb built-in database and serves information needed by the clients.
The server needs elvyxserver.properties to save the parameters used.
The file elvyxserver.properties has the following parameter.
port = 4448
Commands list :
EDT: Erase database. This command erases all data in database.
FIL: ********************************************************
GDT: Get data details per statement. It returns data per sql statement.
GLS: Get data. It return the basic information shown in the evlyx client, sqls, i.e., elapsed time, counts, etc...
LOD: Load file sent by driver in database
LOG: ************************************
STP: Stop server. If this command is received the server is finished.
The client shows the information collected in a more friendly way.
The client uses elvyxclient.properties to save its parameters.
port = Port where the server is running
hostaddress = IP where server is running
confirmdelete = If yes, it activates a warining dialog before it erases data in the database.
lookandfeel = Change look and feel.
refreshtime = Time in seconds to refresh the data table.
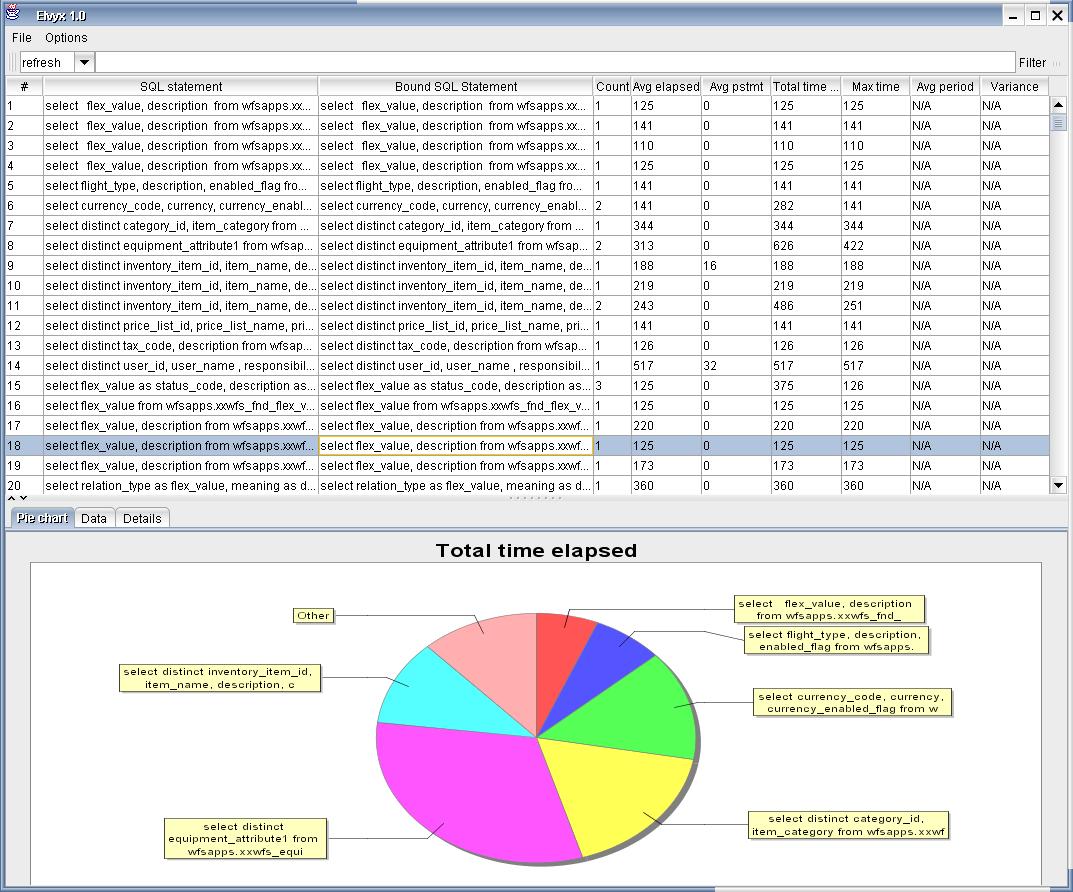
Count: Bound sql statements executions
Avg elapsed: Sql statement execution average elapsed time
Avg pstmt: Average time preparing sql statement
Total time: Count * Avg elapsed
Max time: Maximum time registered
Avg period: Average time between sql execution. Ex: If one sql statement was executed at 8:10, 9:10, 10:10 then the time between them is 1 hour, the average is 1 hour. You need more than 2 values measured.
Variance: Variance of time between sql execution. It is a measure of variability. If the variance is 0 or close to 0, the sql statement is executed periodically; otherwise, it is executed randomly.
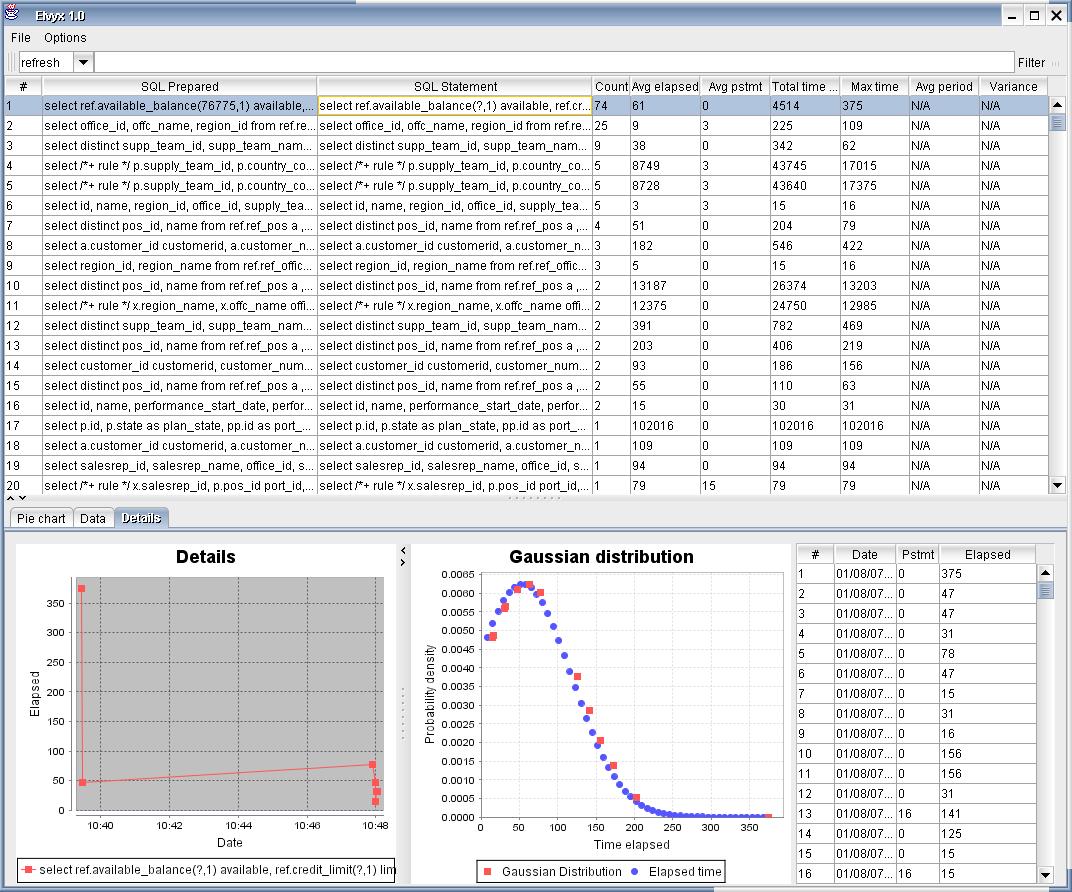
Once you choose a sql statement, the client shows the last 1000 executions including the date it was executed, time elapsed and prepared sql time elapsed.
The gaussian is adjusted using the elapsed time.
Detail chart includes date when executed vs elapsed time.
Files
Options
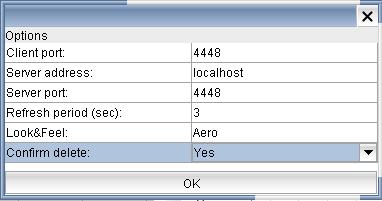
Using options you can change the parameters in elvyxclient.properties